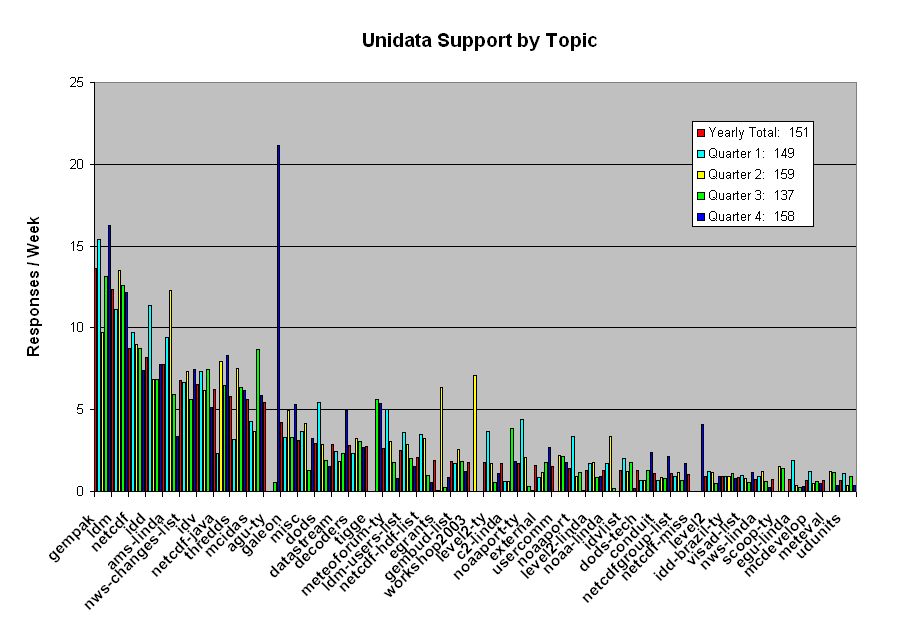
Above are histograms that portray the number of Unidata email
responses for individual topics of support for a one year period
ending March 30, 2005. The histograms are arranged by yearly
activity averages with the highest on the left and lowest on the
right. Each quarter year within the period is depicted from oldest to
newest from left to right. The number of responses has been normalized
to weekly averages so that the support load over the various periods
can be easily compared.
Total support averaged 151 responses/week over the entire year; 149 for
the first quarter; 137 for the second quarter; 150 for the third
quarter; and 158 for the current quarter.
Comments
The LEAD numbers are an underestimate of its
activity since very few LEAD email transactions go through
User Support. This is being changed with the adoption of our
new Inquiry Tracking System.
Support numbers for individual packages, groups, and lists can be seen in
full support statistics.
Some tentative conclusions
The total support provided by the UPC remains high. Overall support
activities are for the most part seasonally invariant.
The numbers presented are virtually identical to those reported in the
Fall 2005 Support status report.
Support required for the legacy visualization packages GEMPAK and McIDAS
continues to be substantial with GEMPAK leading the way as the most
widely distributed analysis application. The IDV support
load continues to grow as more users adopt the package.
Support required for LDM, IDD, and data continues at a high level
and shows some variability throughout the year.
Support for netCDF remains substantial, but is considered modest
given the number of users of the package worldwide.
The overall higher numbers for outreach reflect inclusion of more
categories of support/outreach provided by Linda and the
high level of activity in organizing a special session for
the Spring 2006 AGU Joint Assembly that will be held in
Baltimore, MD on 23-26 May.
Taken as a whole, the support required for visualization packages
(GEMPAK, IDV, and McIDAS) is comparable to the support
related to data reception (LDM, IDD, noaaport).
Support for any package increases after a new version of the package is
made available.
NOTE
These numbers and conclusions should not be taken too literally, for
several reasons:
For some packages, multiple responses in the same thread may be
bundled into a single archived email. Other packages have each
response in a thread counted separately.
After a new release of software, there may be a flurry of the same
or similar questions, which can be answered in separate emails or in
a single mailing list posting.
The graph primarily represents support of end users and site
administrators, not developers. Support for non-Unidata developers in
projects such as OPeNDAP/DODS, THREDDS, IDV, GEMPAK, and McIDAS requires
significant resources, but is difficult to assess.
Not all support records were indexable for this report. Given this,
the above numbers are an underestimate of the
actual support being provided by the UPC.