Hi Murray, Don,
thanks to Don's explanation, I have got the exact result I was after.
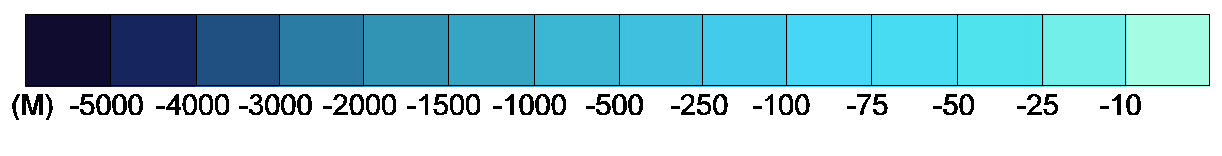
This is my color table and levels:
http://www.ngdc.noaa.gov/mgg/image/IBCAO_GEBCO_comp_colortable_oc.jpg
I took 6000m as the 'bottom', and then 'binned' the color table in 5 m
increments, so I need a table of length 6000/5 = 1200.
I got the rgbs from the jpg using the 'Digital Color Meter' on my mac,
I'm sure other tools can do same. As Don pointed out, its a case of
achieving a linear lookup from the depth value in the data to the color
you want the depth to show as:
// use this float array to build IrregularContourLevels object:

    static float[] GEBCOLEVELS = { 10, 25, 50, 75, 100, 250, 500,
1000, 1500, 2000, 3000, 4000, 5000,
6000 };
        static final Color M10 = new Color( 164, 252, 227 );
        static final Color M25 = new Color( 114, 239, 233 );
        static final Color M50 = new Color( 79, 227, 237 );
        static final Color M75 = new Color( 71, 220, 242 );
        static final Color M100 = new Color( 70, 215, 246 );
        static final Color M250 = new Color( 66, 203, 235 );
        static final Color M500 = new Color( 63, 192, 223 );
        static final Color M1000 = new Color( 59, 183, 211 );
        static final Color M1500 = new Color( 54, 165, 195 );
        static final Color M2000 = new Color( 49, 148, 180 );
        static final Color M3000 = new Color( 42, 124, 164 );
        static final Color M4000 = new Color( 32, 80, 129 );
        static final Color M5000 = new Color( 22, 37, 94 );
        static final Color M6000 = new Color( 16, 12, 47 );

        static final Color[] GEBCOCOLORS = {
            M10, M25, M50, M75, M100, M250, M500,
            M1000, M1500, M2000, M3000, M4000, M5000, M6000 };

        static float[][] GEBCOCOLORTABLE = new float[3][1200];
        static {
            int min = 0;
            int mini = 0;
            for( int l = 0; l < GEBCOLEVELS.length; l++ ) {
                int max = (int)GEBCOLEVELS[l];
                int maxi = max / 5;
                Color c = GEBCOCOLORS[l];
                log.info( c + " " + min + " " + max );
                log.info( c + " " + mini + " " + maxi );
                float[] rgb = rgb( c );
                for( int i  = mini; i < maxi; i++ ) {
                    for( int j = 0; j < 3; j++ )
                        GEBCOCOLORTABLE[j][i] = rgb[j];
                }
                min = max;
                mini = maxi;
            }
        }

        static float[] rgb( Color c ) {
            float[] result = new float[3];
            result[0] = c.getRed() / 256.0f;
            result[1] = c.getGreen() / 256.0f;
            result[2] = c.getBlue() / 256.0f;
            return result;
        }
    }

Stuart


On Apr 22, 2008, at 3:14 AM, Murray Brown wrote:
Stuart,
We've had that same problem, i.e. if you have x colors and want a set
of RGB
values that makes an evenly "colored" rainbow, where do you get them?
It might be out there, but I just couldn't fine an objective way to
simply specify x and read the values from a table or an algorithm. If
you've already found what you need, then ignore the following.
Our
solutions comes from the very useful little GIS program called Saga
(http://www.saga-gis.org/) , which
we use extensively for raster management, conversions and display. When
you've loaded any raster, you can use the SETTINGS menu to set the
coloring
scheme, and it has a "preset" scheme called RAINBOW where you can
select the
"count" of colors. The algorithm gives you a "linear" set of RGB
values in
a pallette that can be exported. One hitch is that the pallette is
binary,
but I spent some time reverse-engineering the format, and figured it out.
The roadmap attached here is one I give my students (in the IOC's marine
data management training program), and it should be enough for you to
figure
it out.
We make a TIF image of the pallette in Saga itself, and will be
creating the RGB pallettes for use in a WMS mapfile.
Murray Brown
PS. You'll have to put the image in a folder named 'images' to get
the html page to look right.
M


----- Original Message -----
From: "Stuart Maclean" <stuart@xxxxxxxxxxxxxxxxxx>
To: <>
Cc: <idvusers@xxxxxxxxxxxxxxxx>
Sent: Monday, April 21, 2008 6:27 PM
Subject: Re: [idvusers] trying to contour fill bathy according to
knownlevels and color table


> Hi Don, thanks for the prompt reply (as always)..
>
> I do not quite follow your suggestion:
>
>> At present, the only solution would be to generate a linear
>> table with enough levels to create the linear scale.
>>
>
>
> How do I make the 'linear table'?
>
> Also, how did you assert that the color table in the graphic is a
> 'linear table'?  And what does that mean exactly?
>
> Could you also explain the intended use of the
> Contour2DGridDisplayable's
>
> setColorPalette
>
> and
>
> setContourLevels
>
> Thanks
>
> Stuart
>
>
> _______________________________________________
> idvusers mailing list
> idvusers@xxxxxxxxxxxxxxxx
> For list information, to unsubscribe, visit:
> http://www.unidata.ucar.edu/mailing_lists/
>
<ASC-to-TIF-4-wms.htm><ASC-to1.jpg>