A test of the Barnes analysis in the IDV gives odd results.
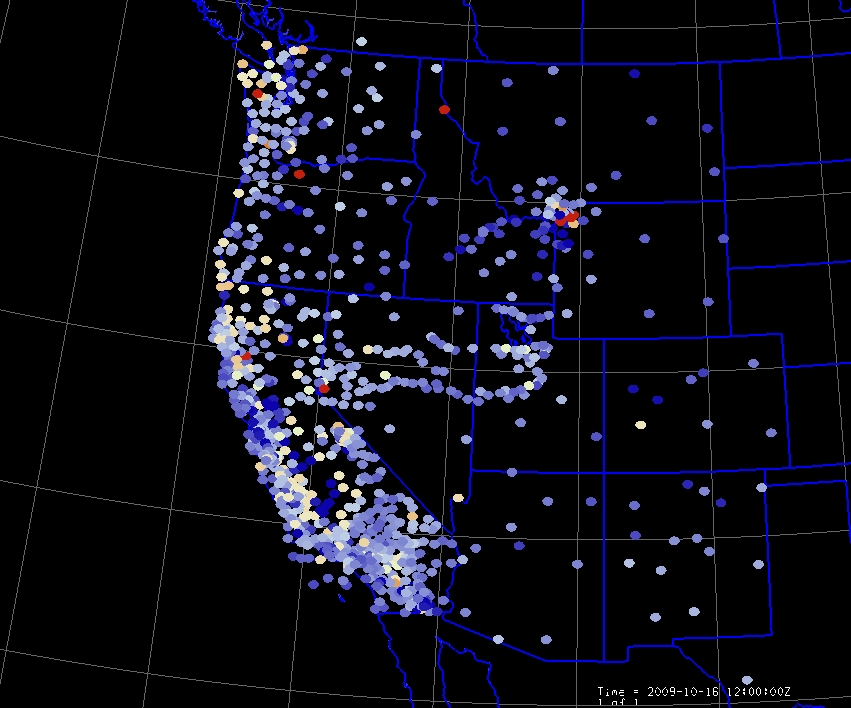
The first image here shows the point observations as dots colored by value.
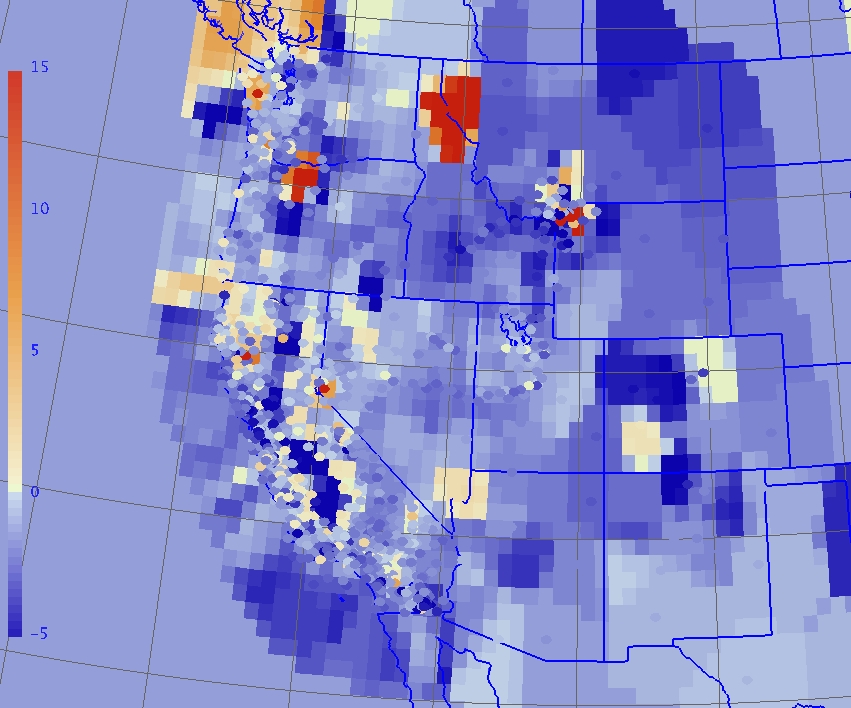
The second image adds in a grid made with the Barnes analysis in the IDV. Both
data use the same color scale and range.
Note the poor grid values in some places, such as the pale region of positive value in the right side, center, where
there are no positive values in the observations anywhere nearby.
Any suggestions about what is happening or how to get a better result will be
appreciated.

S K Wier

UNAVCO