I made some corrections (incl. wind barbs correctly plotted in knots) to
the notebook and added different dewpoint-from-specific humidity
calculations to compare, as well as verification against the AWIPS2 NSHARP
modelsounding display.
For reference:
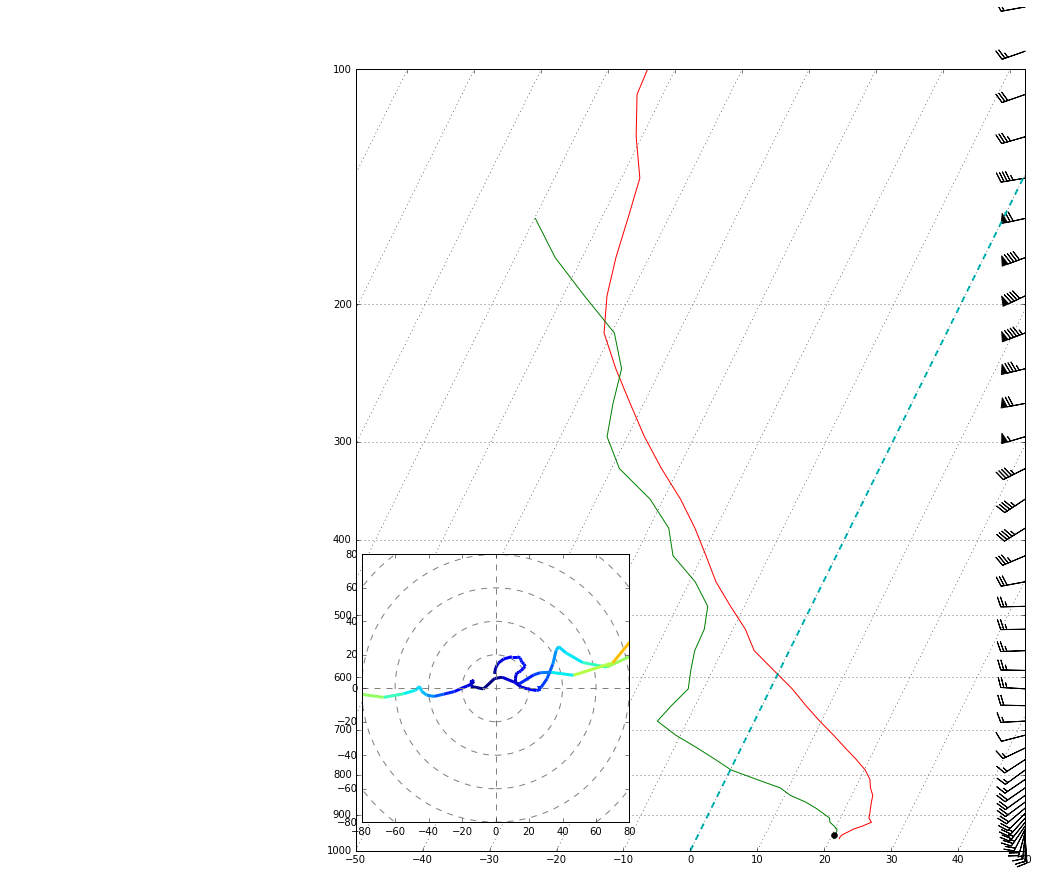
- datetime = 20160714/1200 UTC
- source = ETAbufr
- station = WSC
- lat/lon = 44.13999938964844 ,-93.55999755859375
Dewpoint is calculated three times:
1) metpy-calculated mixing ratio and vapor pressure
- rmix = (s/(1-s)) *1000 * units('g/kg')
- e = vapor_pressure(p, rmix)
- td = dewpoint(e)
2) metpy assuming specHum = mixing ratio:
- td2 = dewpoint(vapor_pressure(p, s))
3) following
https://github.com/Unidata/awips2-ncep/blob/unidata_16.2.2/edex/gov.noaa.nws.ncep.edex.plugin.soundingrequest/src/gov/noaa/nws/ncep/edex/plugin/soundingrequest/handler/MergeSounding.java#L1783
- rh = 0.263*nprs*nsh / (np.exp(17.67*ntmp/(ntmp+273.16-29.65)))
- vaps = 6.112 * np.exp((17.67 * ntmp) / (ntmp + 243.5))
- vapr = rh * vaps / 100
- dwpc = np.array(243.5 * (np.log(6.112) - np.log(vapr)) / (np.log(vapr)
- np.log(6.112) - 17.67)) * units.degC
The differences between these are negligible, simply print differences and
visually check the overlay of each on the attached notebook skewt plot and
you can see they align well, though they are not exact (they are printed as
columns at the end of the attached notebook).
I also added an array "a2td" which contains the dewpoint values scraped
from the AWIPS2 NSHARP "ShowText" window. Again the difference is
negligible.
But you are right that something was off in that GFSbufr 0713/1200 UTC plot
yesterday (unfortunately our EDEX server purged those data and I'm unable
to re-ingest since the files on both ftp.ncep.noaa.gov and
tgftp.nws.noaa.gov seem to be formatted differently that what comes across
the HDS NOAAport feed).
In these two attached images notice the MetPy-calculated dewpoint values
exceed temperature above 300mb, which is obviously incorrect. I haven't
found another case like this in the 0714 soundings.
Michael James
Unidata Program Center
Boulder, CO
On Wed, Jul 13, 2016 at 5:33 PM, Bryan Guarente <guarente@xxxxxxxx> wrote:
> Does this mean that we can only plot for RAOB locations or can we plot for
> any lat lon point available in the dataset?
>
> I thought we could just replace that "geom = POINT (... , ...)" line with
> an appropriate lat lon location and then "fool" it into getting the data
> from that location instead of OAX.
>
> I don't believe that we could use the specific humidity for the vapor
> pressure. The linked sounding (AWIPS 2 Cave) here is the same as you had
> in the example posted (KOAX, July 13, 12Z).
>
>
> https://drive.google.com/a/ucar.edu/file/d/0BwAYX88KH9wDSVd2dUNPWWEyckU/view?usp=sharing
>
> It didn't look to me like these were the same.
>
> Thanks for the quick response.
>
> Bryan
>
> On Wed, Jul 13, 2016 at 2:13 PM, Michael James <mjames@xxxxxxxx> wrote:
>
>> and online now
>>
>> http://python-awips.readthedocs.io/en/latest/examples/generated/Model_Sounding_Data.html
>>
>> Michael James
>> Unidata Program Center
>> Boulder, CO
>>
>> On Wed, Jul 13, 2016 at 2:47 PM, Ryan May <rmay@xxxxxxxx> wrote:
>>
>>> On Tue, Jul 12, 2016 at 11:21 AM, Bryan Guarente <guarente@xxxxxxxx>
>>> wrote:
>>>
>>>> I have worked through my own version of your sounding and advanced
>>>> sounding examples using python-awips and metpy. However, I never saw any
>>>> ability to make a model sounding. Is there an example of making a model
>>>> sounding with MetPy and python-awips? Initially, I think this would be
>>>> simple, but then I realized we would be using a completely different
>>>> filetype and thus would likely have to use a different library to decode
>>>> it.
>>>>
>>>> If you have any examples, can you post them to github?
>>>>
>>>
>>> Bryan,
>>>
>>> Michael James (cc'ed, maintainer of python-awips) came up with the
>>> attached and had this to add:
>>>
>>> "I believe this is correct, assuming specific humidity is equal to vapor
>>> pressure e (modelsounding doesn't return dewpoint). Also note that the
>>> available locations are limited to areas around OAX due to localization.
>>> I'll have to update this to allow global access in the next release."
>>>
>>> I'm currently working on a gallery of notebooks that work across all of
>>> the meteorology tools, and I'll add these when that's ready (I don't want
>>> MetPy's own examples pulling from external, online data sources.)
>>>
>>> Ryan
>>>
>>> --
>>> Ryan May, Ph.D.
>>> Software Engineer
>>> UCAR/Unidata
>>> Boulder, CO
>>>
>>
>>
>
>
> --
> Bryan Guarente
> Instructional Designer/Meteorologist
> The COMET Program
> Boulder, CO
>
Attachment:
Model_Sounding_Data-Validate.ipynb
Description: Binary data
Attachment:
screenCapture-2016.07.14.00.41.47-20160718_120000.png
Description: PNG image
Attachment:
download (5).png
Description: PNG image
python-users archives: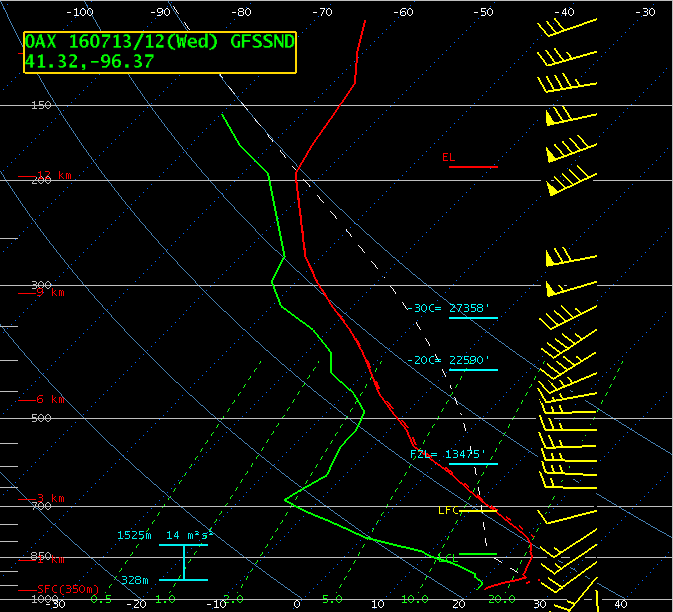